Export and share
Click the Export button in the navbar to open the export dialog. You can publish the current view to Confluence, or download it as a Markdown, CSV, PDF, or PNG file.
PDF and PNG capture what is currently visible on the canvas - pan and zoom first to frame the view you want.
01. The five formats at a glance
| Format | What you get | Best for |
|---|---|---|
| Confluence | A new Confluence page with project tables, dependency lists, and links into Jira | Long-form documentation, team handoffs |
| Markdown | A .md file with the same content as the Confluence page | Internal wikis, ChatOps snippets |
| CSV | A .csv edge list - one row per dependency, with full source/target metadata | Spreadsheets, ad-hoc analysis |
| A vector PDF capture of the current canvas region | Print-quality posters, slide decks | |
| PNG | A raster PNG image of the current canvas region | Quick sharing, screenshots, Slack or email attachments |
02. Confluence export
This format needs Synaps connected to Confluence on your Atlassian site. If it is greyed out, see Connect Synaps to Confluence - a site admin sets it up once.
When the dialog opens, Synaps fetches the list of Confluence spaces you can write to.
- Space - pick the space where the page will live.
- Parent page (optional) - type to search; pick a parent or leave it at the top level.
- Click Publish - Synaps creates the page and shows you the link.
The page is named Synaps - <view name> - <date and time>, so two exports in the same space do not collide.
If you do not have write access to any Confluence space (or Synaps is not connected to Confluence), this format is disabled in the dialog.
03. Markdown export
Same content as the Confluence export, downloaded as a local file. Useful when you want the structured rundown without publishing anywhere.
04. CSV export
An edge list - one row per project-to-project dependency, with twelve columns: source and target project key and name, category, lead and lead email, link type, and the link count. Open it in Excel, Google Sheets, or any data tool. The file is UTF-8 with a BOM so Excel reads accented characters correctly, and values are sanitised so spreadsheets never execute them as formulas.
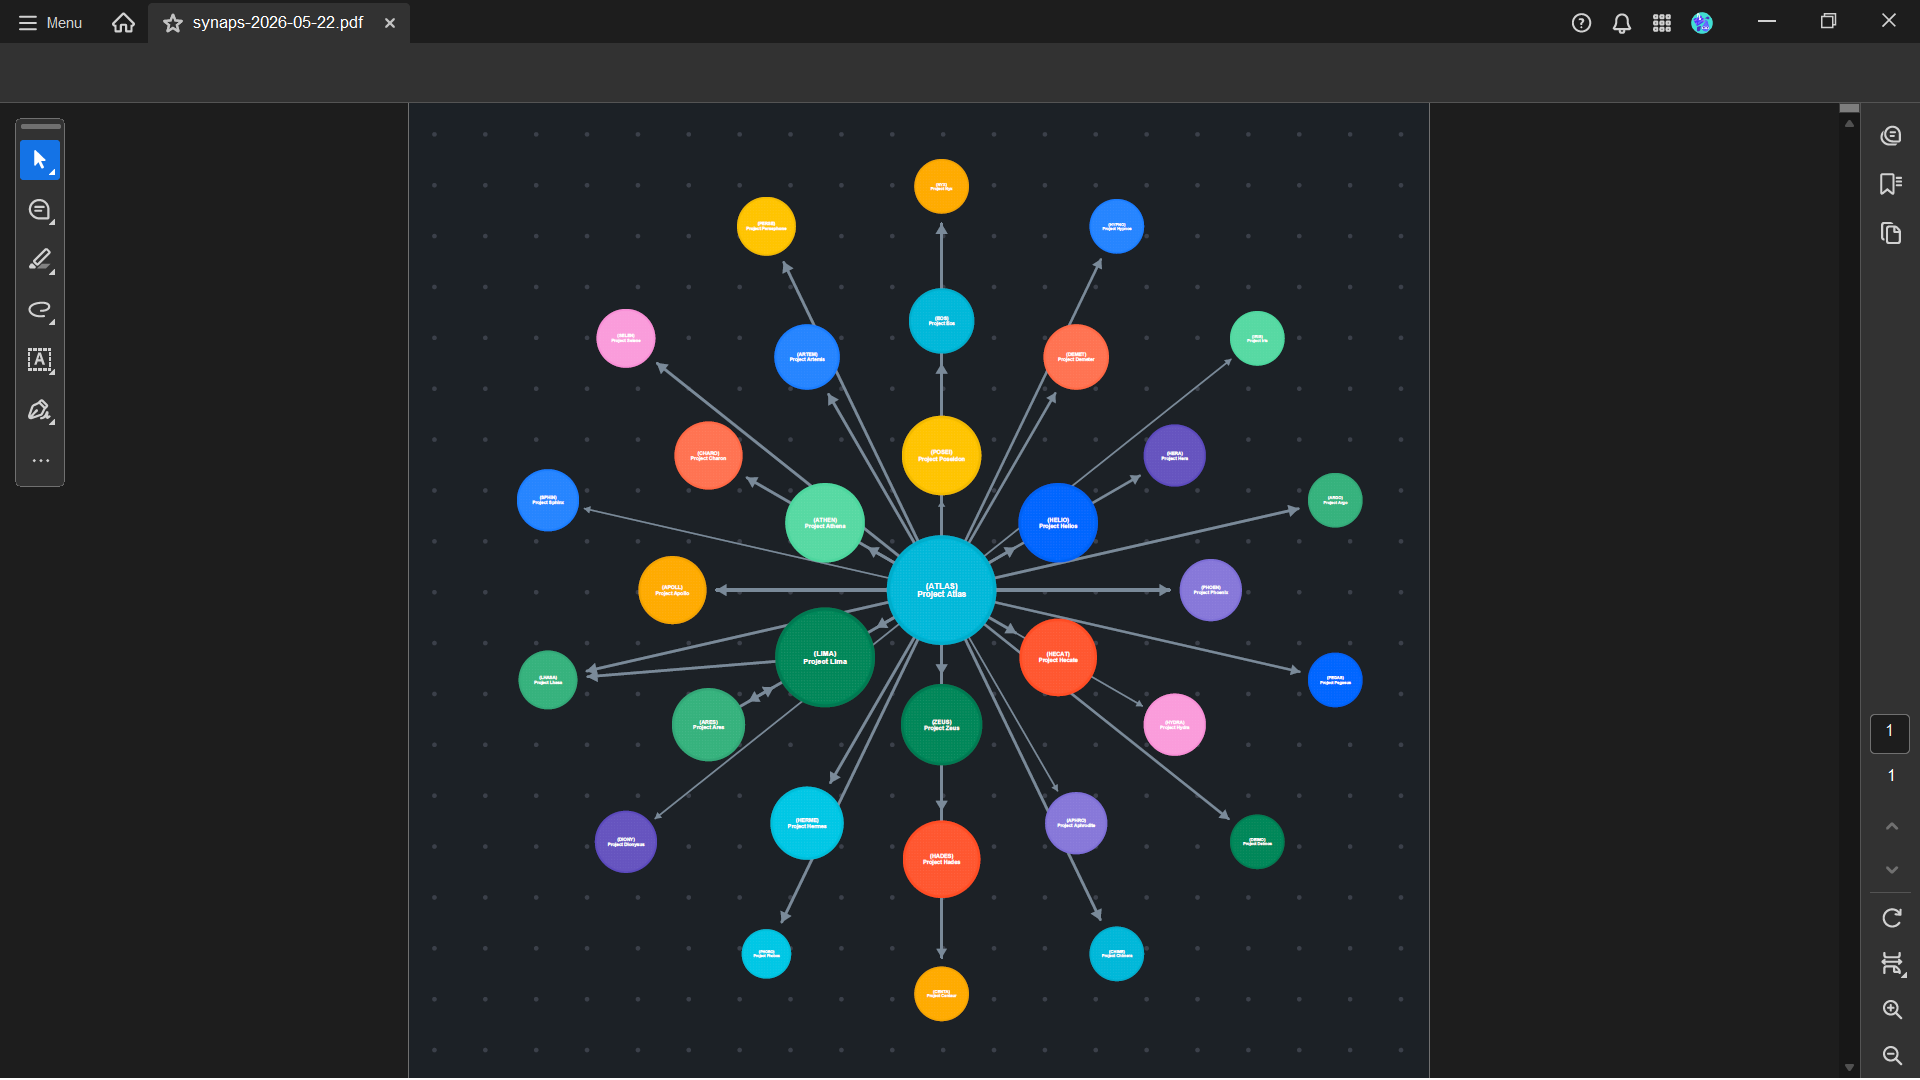
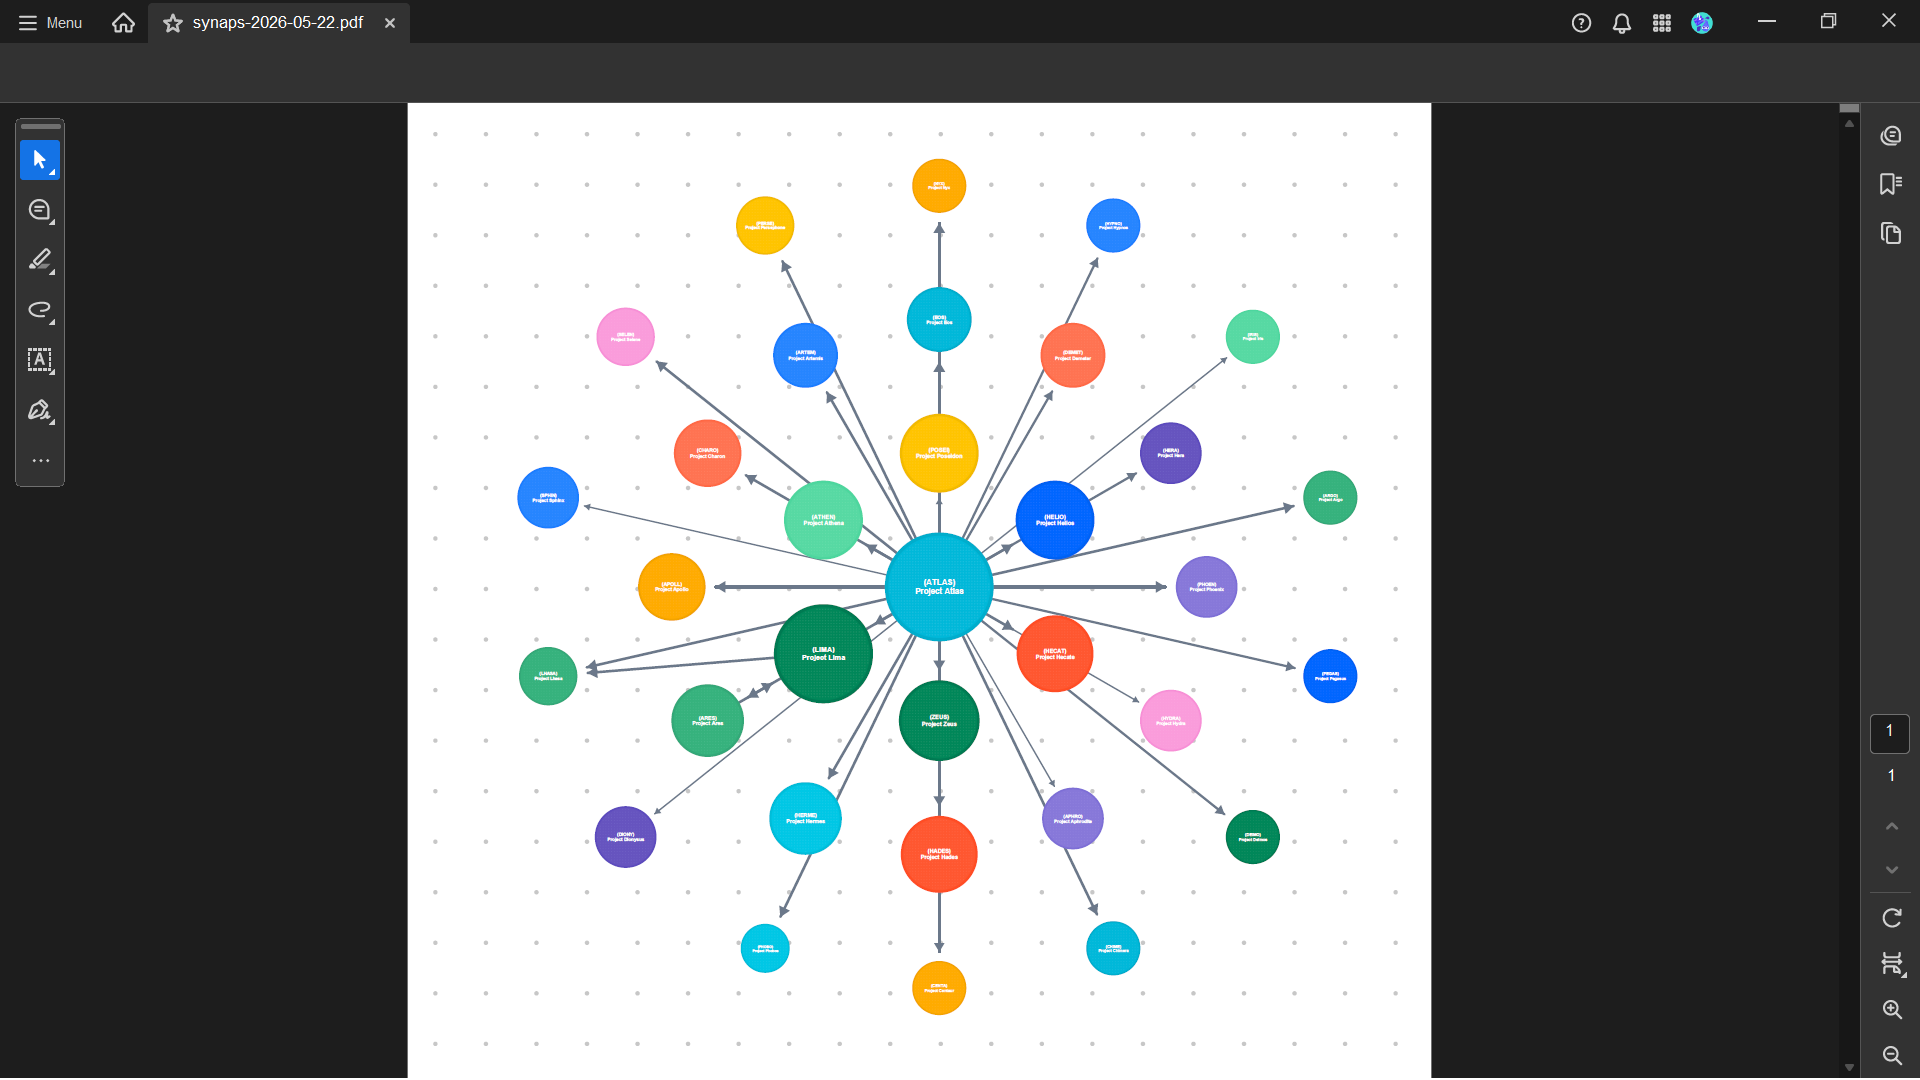
05. PDF and PNG - capturing the canvas
PDF and PNG are available from Graph View only. In Table View there is no canvas to capture, so the export dialog offers the text formats (Confluence, Markdown, CSV) alone.
Picking PDF or PNG closes the dialog and switches the canvas into region-selection mode - a hint reads "Drag to select an area • Esc to cancel".
- Drag a rectangle around the area you want to capture.
- For a PNG, optionally pick a resolution (see below).
- Click Capture to generate and download the file - or Cancel to back out.
You can press Esc at any point to cancel.
PNG resolution
PNG captures offer a resolution preset - Standard, High, or Maximum (the default) - in the capture overlay, and Synaps remembers your choice for next time. The setting is PNG-only: PDF is a vector format and always exports at full fidelity. Every preset is clamped under 8192 pixels per side so the file stays manageable.
The PDF is a vector file - clickable project circles link straight to the Jira project page, and you can zoom in indefinitely without losing crispness. The PNG is a raster image.
06. Which view gets exported
The file title and the document body reflect whichever view you have active. When you filter the map, the label spells out the mode:
| Active view | Label |
|---|---|
| Top Projects | Split View (Top 8) (or however many islands) |
| Custom | Split View (12 pinned) (or however many) |
An unfiltered map carries the plain view name with no Split suffix, so you can always tell at a glance which snapshot a file came from.
07. A note on themes
PDF and PNG exports use the same theme you currently have active. If you want a "light" export, switch your Jira theme to light first.