Reading the map
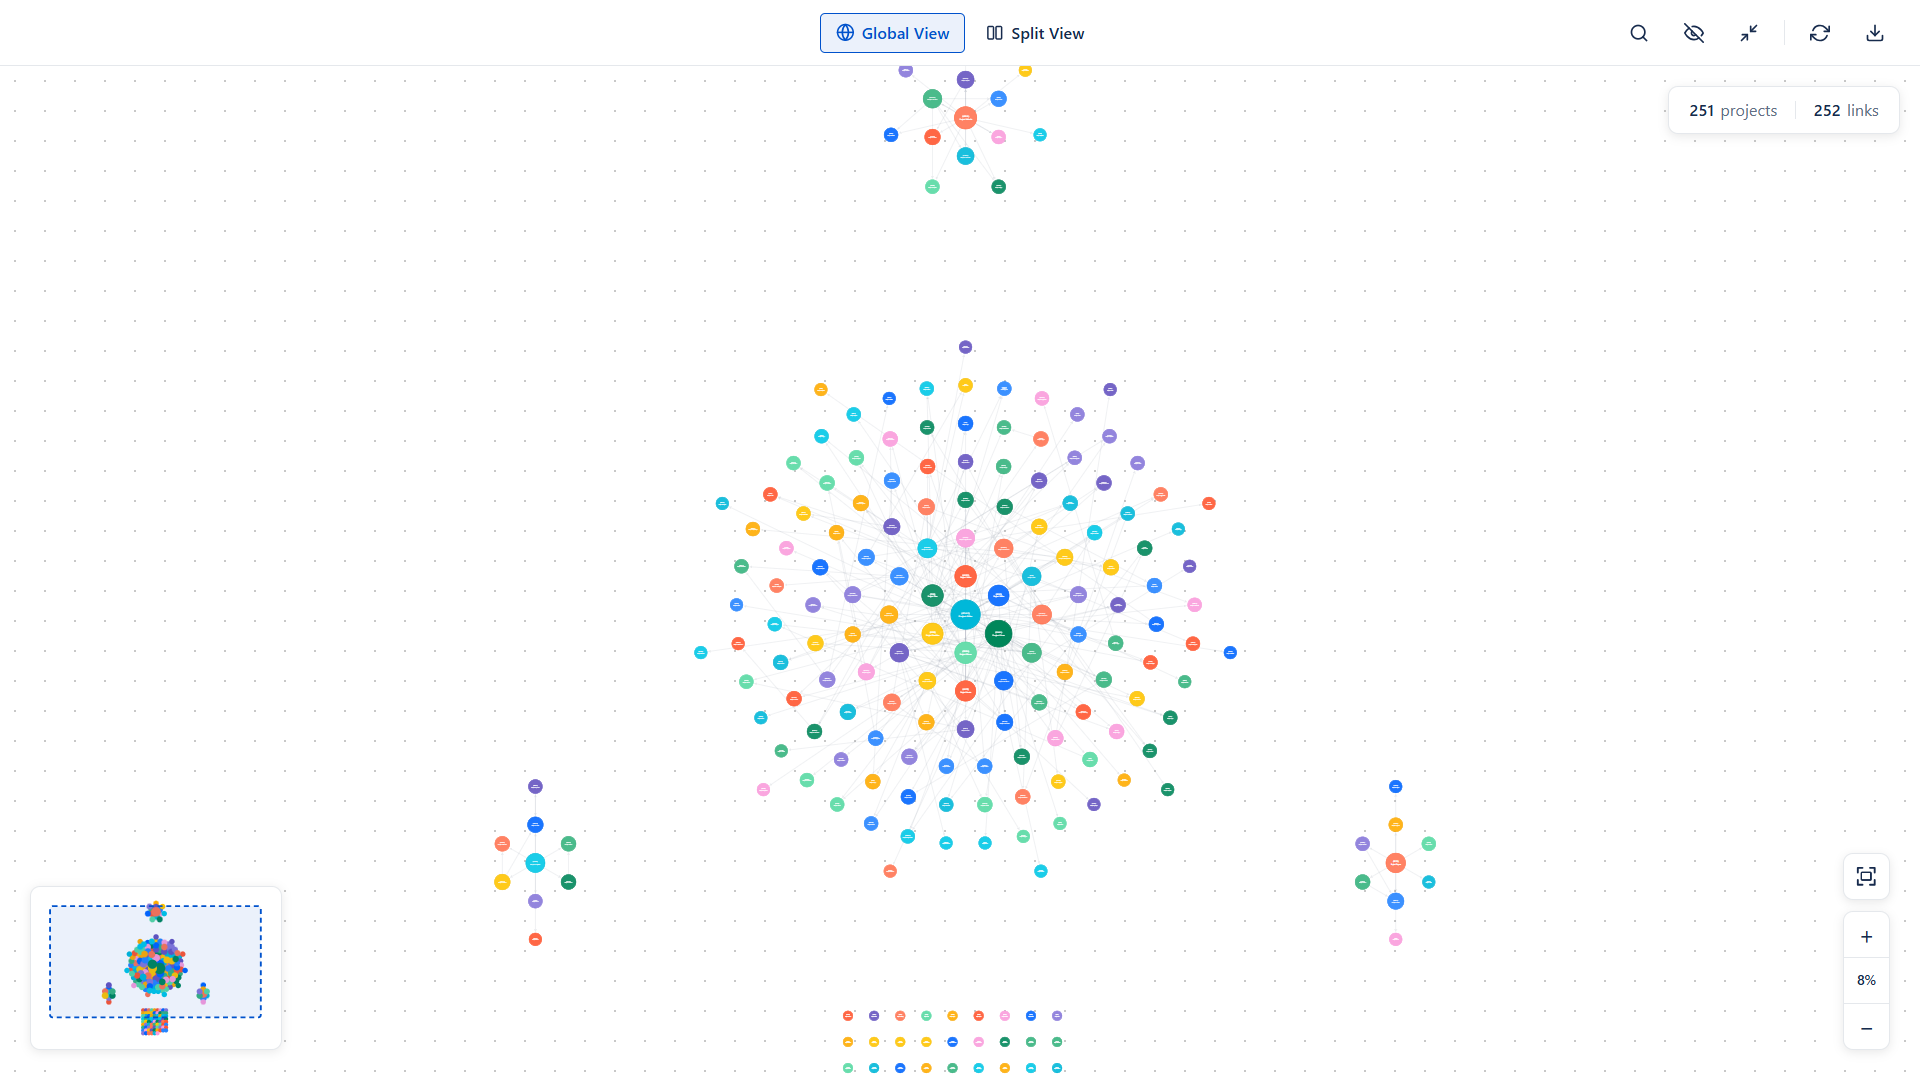
The Synaps canvas turns your whole Jira portfolio into a single picture: every project is a circle, every dependency is a line. This page walks through how to read it.
The result is one picture of how your portfolio is wired together: which projects depend on which, where the heavy traffic is, and which projects work in isolation.
01. What it is useful for
- Spotting hidden dependencies - discover that your team depends on another team you did not realise.
- Planning - before a quarter or a release, see who you need to talk to.
- Conversations with leadership - show, rather than describe, where the critical handoffs are.
- Onboarding - give a new hire a map of the portfolio in one screen.
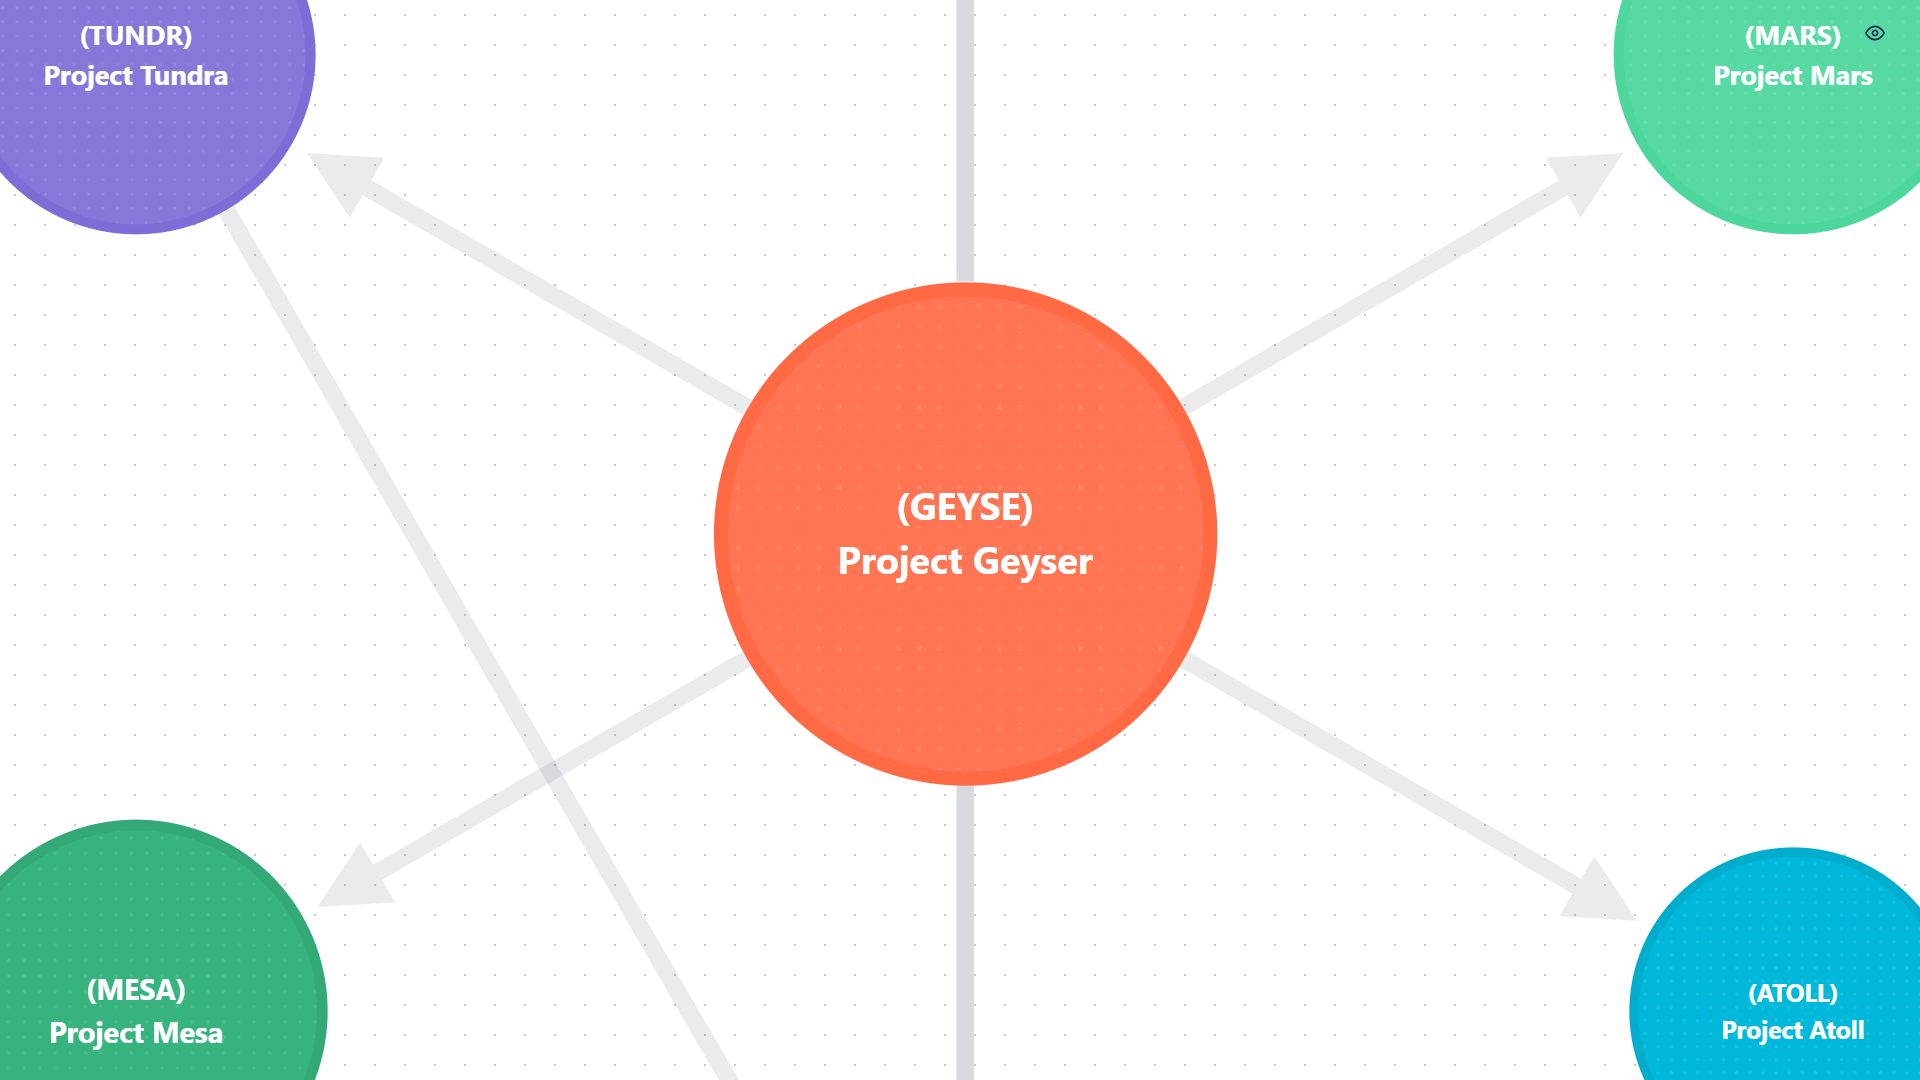
02. The circles (projects)
Each circle is one Jira project. Three things on the circle carry information.
Size
A project's circle grows with the number of other projects it is linked to. The most connected project in view is the biggest; the least connected is the smallest. Sizes are consistent across Global View and Split View, so a project keeps the same relative weight no matter how you slice it.
Position
Synaps lays the map out automatically:
- The most-connected project sits at the centre.
- Everything else orbits in rings around it. Projects closer to the centre are more central to your portfolio.
- Standalone projects (no dependencies) line up in a compact grid below the main cluster.
- Independent clusters (groups that link only among themselves) sit alongside the main cluster.
The layout is stable - open Synaps twice and the same project lands in the same place.
Colour
Each circle is coloured by Jira project category, so projects in the same category share a colour and you can tell groups apart at a glance. The same colour is used everywhere: on the canvas, in the minimap, in PDF and PNG exports.
Label
Inside each circle Synaps shows the project key in parentheses and the project name underneath. Long names wrap onto multiple lines so they stay inside the circle.
03. Interacting with a project
| Action | What it does |
|---|---|
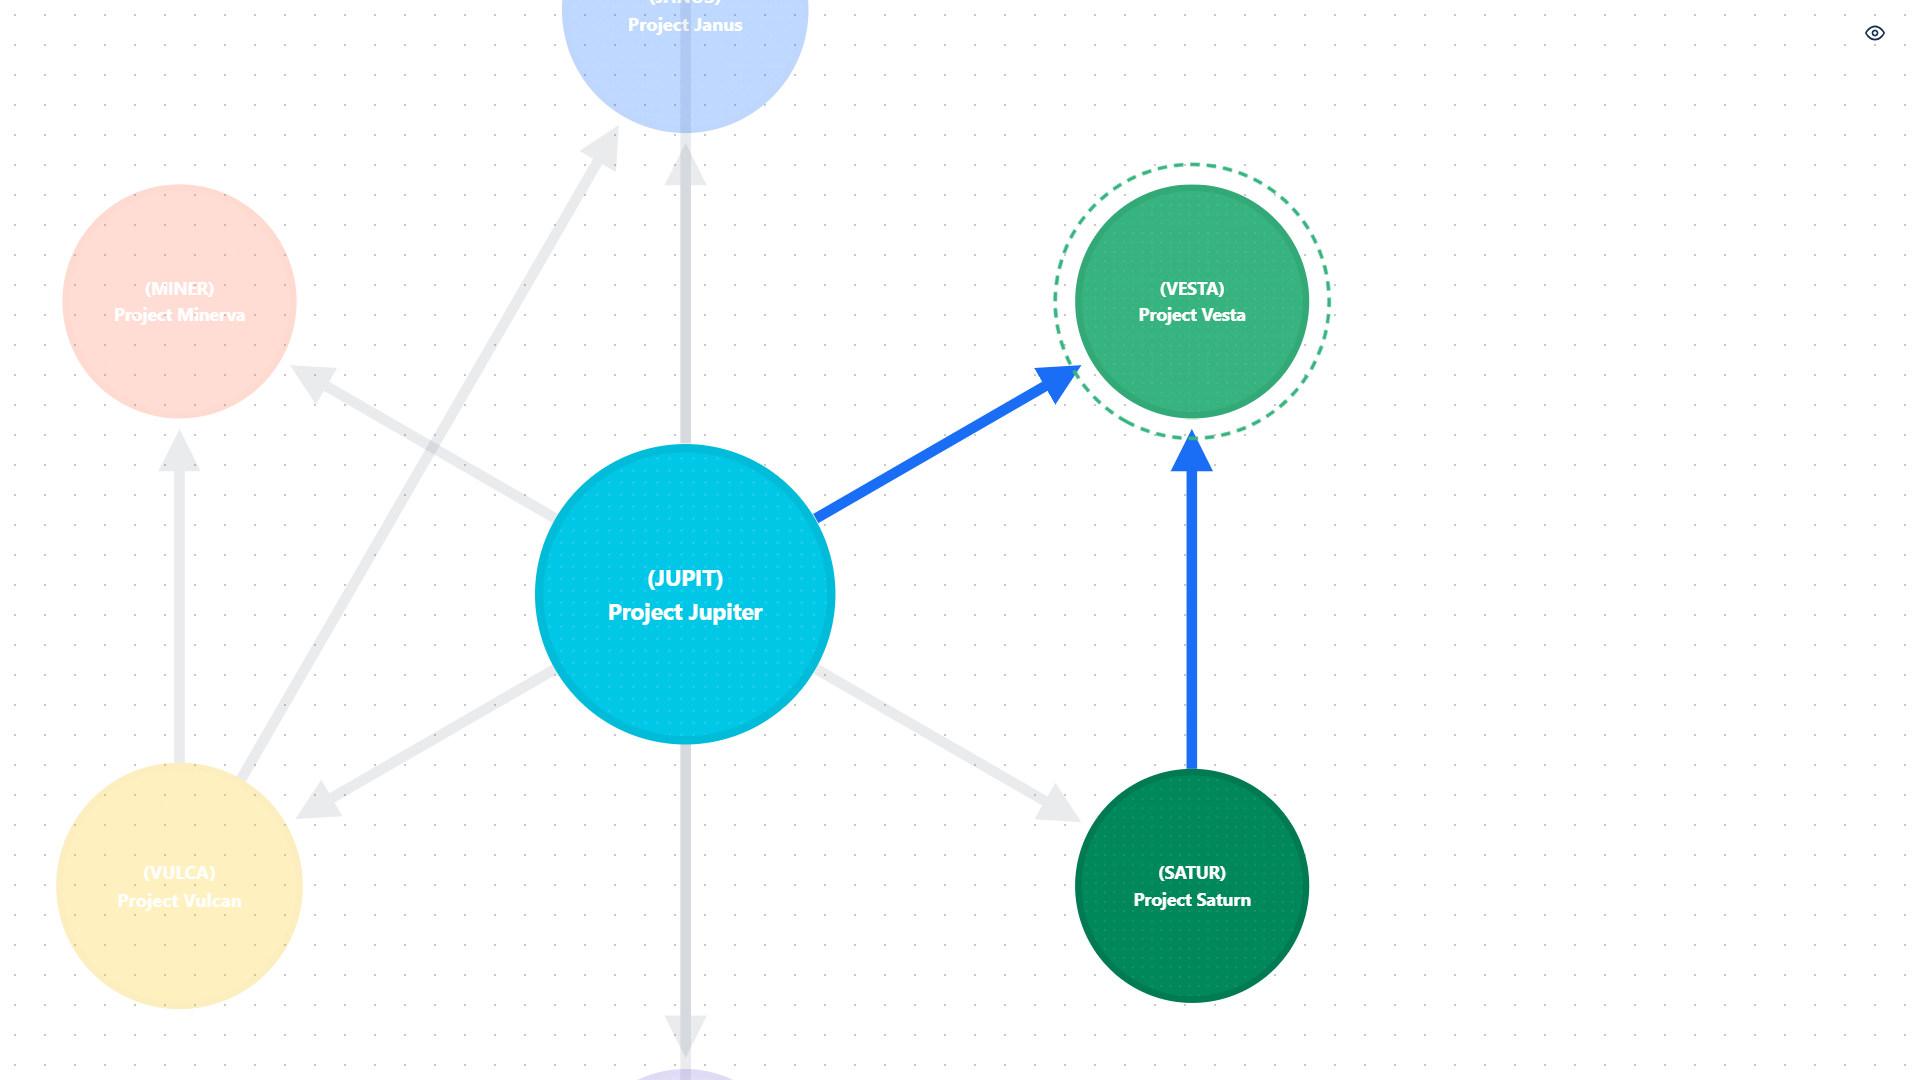
| Hover | Shows a tooltip; connected projects stay highlighted; everything else dims. |
| Click | Selects the project. A rotating dashed ring marks the selection. Press Esc or click another project to clear it. |
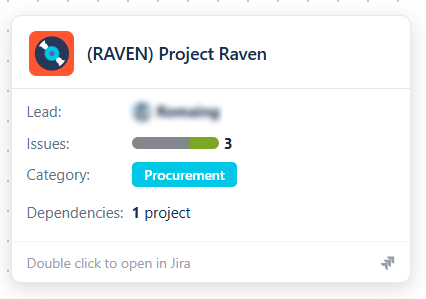
| Double-click | Opens the project in Jira in a new tab. |
While a project is selected, hovering another shows the hovered neighbourhood - the selection stays, but the hover takes visual priority. To clear a selection: press Esc, click empty canvas, or switch between Global and Split View.
04. The lines (dependencies)
Lines represent issue links of type Blocks or Relates. The arrow points from the project that needs something to the project that owns it.
Thickness
A thicker line means more cross-project issue links. The scale runs from one link (thinnest) up to thirty or more (thickest). Thickness is absolute, so the same line looks identical in Global View and Split View and you can compare them directly.
Colour
- Grey by default - neutral, slightly faded so the projects stay the focal point.
- Blue when active - either you hovered the line directly, or you hovered a project at one of its ends.
Interacting with a line
| Action | What it does |
|---|---|
| Hover | Highlights the line in blue and pops up a tooltip with source/target details. |
| Click | Opens the Dependency details panel listing every individual issue link. |
| Double-click | Opens a Jira search showing the underlying issues. |
Clicking a line never clears your project selection, so you can keep a project selected while exploring its dependencies.
05. Tooltips
Hover almost anything and a tooltip explains what you are looking at. Three flavours appear:
- Quick label tooltips on navbar buttons and icons, showing the keyboard shortcut in a small key-cap badge.
- Project tooltips with the project avatar, key, name, lead, category, dependency count, and a stacked bar of To Do / In Progress / Done issues.
- Dependency tooltips with source and target projects, total linked issues, and a breakdown by link type.
Only one rich tooltip shows at a time, and tooltips clear themselves when you switch tabs or windows.
06. Locked projects
Sometimes your team depends on a project you cannot see - typically a private project owned by another team where you do not have Browse Projects permission. Synaps does not pretend these dependencies do not exist; it shows them, marked clearly.
A locked project looks like this:
- Diagonal stripes instead of the usual solid fill.
- A lock icon at the centre.
- The project key and name (Synaps fetches the name via an elevated lookup so you can see which project the dependency points to).
- Dashed lines for every dependency touching it.
Double-clicking a locked project is disabled - opening it in Jira would just fail. You can still click the line to a locked project and see the underlying issues from the side you do have access to.
Locked dependencies are exactly the kind you would miss without a map: you may not realise your team depends on a private project until you see the line. The locked node's key gives you something concrete to ask about ("who owns SECRET?").